These US average car age statistics show how long Americans are keeping their vehicles on the road. The latest widely cited data points come from 2025, and most official series track passenger cars and light trucks together as light vehicles rather than cars alone.
The headline trend is simple: the average age of vehicles on US roads has kept rising, reaching a record 12.8 years in 2025. Passenger cars are older on average than light trucks, while battery electric vehicles remain much younger because the fleet is still relatively new.
us average car age statistics
US average car age statistics (Top Highlights)
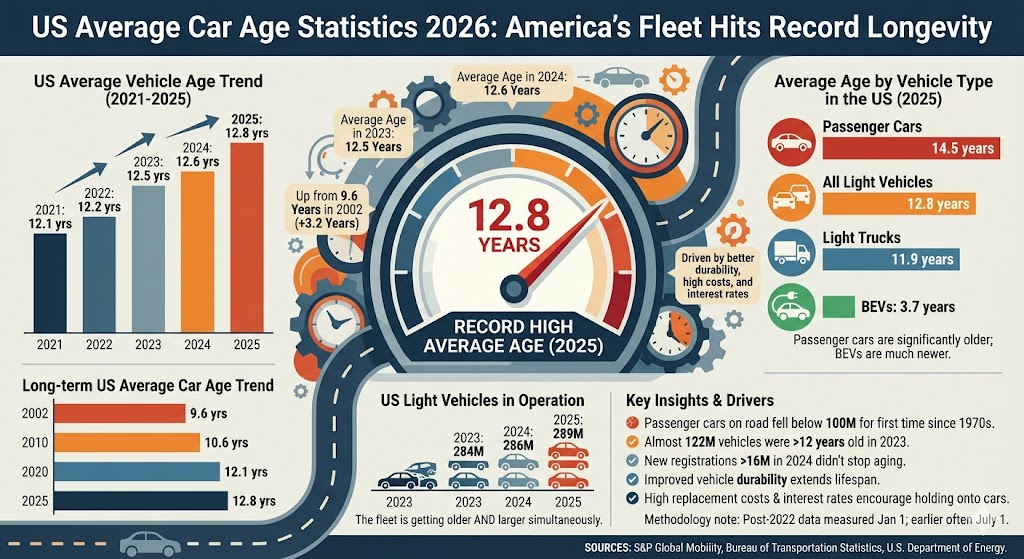
The average age of US light vehicles reached a record 12.8 years in 2025.
The average age was 12.6 years in 2024 and 12.5 years in 2023.
The average age of US light vehicles was 12.1 years in 2021.
In 2002, the average age of US light-duty vehicles was 9.6 years, showing a 3.2-year increase by 2025.
Passenger cars averaged 14.5 years old in 2025.
Light trucks averaged 11.9 years old in 2025.
Battery electric vehicles averaged 3.7 years old in 2025.
US light vehicles in operation reached 289 million in 2025, up from 286 million in 2024 and 284 million in 2023.
New vehicle registrations topped 16 million in 2024 for the first time since 2019, but that was still not enough to stop the fleet from aging.
Passenger cars on US roads fell below 100 million in 2025 for the first time since the early 1970s.
Almost 122 million vehicles in operation were already more than 12 years old in 2023.
US average vehicle age trend (2021-2025)
Label
Bar
Value
2021
12.1 years
2022
12.2 years
2023
12.5 years
2024
12.6 years
2025
12.8 years
Max = 12.8 years. Widths: 2021 94.53%, 2022 95.31%, 2023 97.66%, 2024 98.44%, 2025 100.00%
Long-term US average car age trend
Label
Bar
Value
2002
9.6 years
2010
10.6 years
2020
12.1 years
2025
12.8 years
Max = 12.8 years. Widths: 2002 75.00%, 2010 82.81%, 2020 94.53%, 2025 100.00%
Average age by vehicle type in the US (2025)
Label
Bar
Value
Passenger cars
14.5 years
All light vehicles
12.8 years
Light trucks
11.9 years
BEVs
3.7 years
Max = 14.5 years. Widths: Passenger cars 100.00%, All light vehicles 88.28%, Light trucks 82.07%, BEVs 25.52%
US light vehicles in operation
Label
Bar
Value
2023
284M
2024
286M
2025
289M
Max = 289M. Widths: 2023 98.27%, 2024 98.96%, 2025 100.00%
What the US average car age data shows
The average car age trend in the United States points to a fleet that keeps getting older even as new vehicle sales recover. Better durability, high replacement costs, elevated interest rates, and tighter affordability have all helped extend how long drivers keep their vehicles.
The split between passenger cars and light trucks also matters. Passenger cars are now much older on average, while light trucks dominate new registrations and a larger share of the fleet. That is one reason the average age of a passenger car is now notably higher than the average age of the overall light-vehicle market.
Another useful takeaway is that an aging fleet does not mean the total vehicle population is shrinking. The number of vehicles in operation has continued to rise, which means the US is supporting both a larger fleet and an older fleet at the same time.
One methodology note is worth keeping in mind when comparing long historical series: BTS notes that 2022 and later data are measured as of January 1 for that year, while many earlier values were measured as of July 1.
Sources
S&P Global Mobility, Average Age of Vehicles in the US Hits 12.8 Years in 2025, May 21, 2025.
S&P Global Mobility, U.S. Vehicle Age Rises Again to 12.8 Years in 2025, May 21, 2025.
S&P Global Mobility, Average age of vehicles hits new record in 2024, May 29, 2024.
S&P Global Mobility, Average Age of Light Vehicles in the US Hits Record High 12.5 years, May 15, 2023.
Bureau of Transportation Statistics, Table 1-26: Average Age of Automobiles and Trucks in Operation in the United States.
U.S. Department of Energy, Fact of the Week 1198: Average Age of U.S. Light-Duty Vehicles Reached New High, August 9, 2021.
U.S. Department of Energy, Fact 997: Average Age of Cars and Light Trucks Was Almost 12.0 Years, October 2, 2017.
Step up your car audio game with the 10 best coaxial speakers for rear decks—discover which models will elevate your listening experience to new heights!
Navigating the world of sealed car subwoofer enclosures reveals top picks that promise unmatched bass performance—discover which ones truly deliver the sound you crave.