These car dealership statistics highlight the latest U.S. data on franchised and independent dealers, including dealership counts, sales volume, service revenue, employment, profitability, financing trends, and dealer sentiment. Because public dealership reporting is strongest in the United States, the figures below are primarily U.S.-focused.
Car Dealership Statistics (Top Highlights)
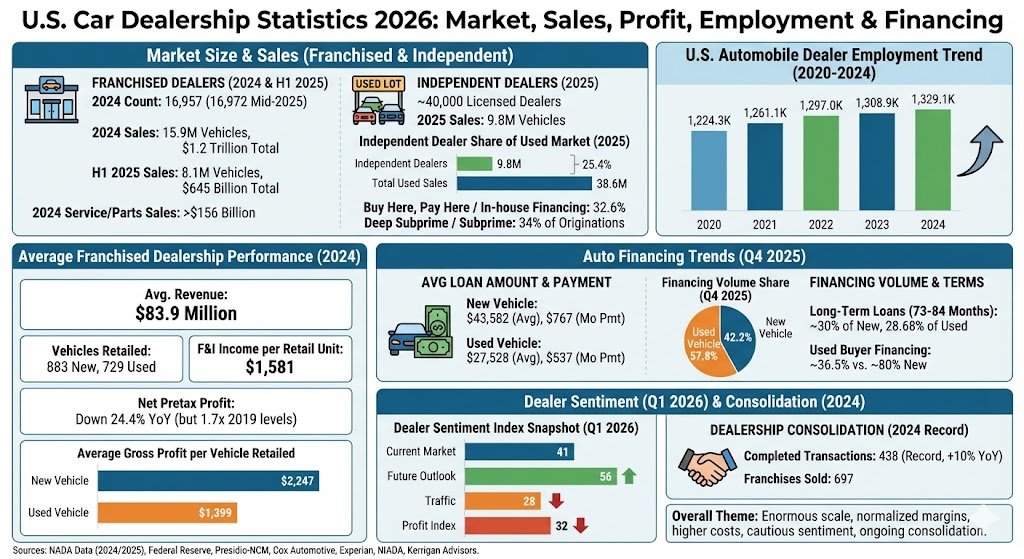
- U.S. franchised light-vehicle dealerships totaled 16,957 in 2024.
- The franchised dealership count edged up to 16,972 by mid-2025.
- Franchised light-vehicle dealers sold 15.9 million vehicles in 2024.
- Total franchised light-vehicle dealership sales topped $1.2 trillion in 2024.
- Franchised dealers wrote more than 270 million repair orders in 2024.
- Service and parts sales at franchised dealerships exceeded $156 billion in 2024.
- In the first half of 2025 alone, franchised dealers sold 8.1 million vehicles and generated $645 billion in sales.
- Automobile dealer employment reached 1.329 million jobs in 2024.
- The average U.S. franchised dealership generated $83.9 million in revenue in 2024.
- The average franchised store retailed 883 new vehicles and 729 used vehicles in 2024.
- Average gross profit per new vehicle retailed was $2,247 in 2024, versus $1,399 per used vehicle.
- F&I income per retail unit averaged $1,581 in 2024.
- Net pretax profit at the average U.S. franchised dealership fell 24.4% in 2024, but still remained 1.7 times 2019 levels.
- Independent used vehicle dealers sold 9.8 million vehicles in 2025.
- Total used-vehicle sales across all channels reached an estimated 38.6 million in 2025.
- NIADA says the used-vehicle industry includes some 40,000 licensed used auto dealers.
- Buy here, pay here and other in-house financing represented 32.6% of independent dealer financing in 2025.
- Deep subprime and subprime borrowers accounted for 34% of independent dealer originations in 2025.
- Cox Automotive’s current dealer market sentiment index rose to 41 in Q1 2026, while the future outlook index climbed to 56.
- Dealer traffic fell to 28 in Q1 2026, and EV sales sentiment dropped to 33.
- In Q4 2025, average loan amounts reached $43,582 for new vehicles and $27,528 for used vehicles.
- New vehicle financing represented 42.2% of auto finance volume in Q4 2025, compared with 57.8% for used vehicles.
- Loans with 73- to 84-month terms made up nearly 30% of new vehicle financings and 28.68% of used vehicle financings in Q4 2025.
- The dealership buy-sell market hit a record 438 completed transactions in 2024, involving 697 franchises sold.
Franchised car dealership market size and sales
NADA data shows the franchised dealership sector remained one of the largest retail channels in the U.S. economy. In 2024, 16,957 franchised light-vehicle dealers sold 15.9 million vehicles and generated more than $1.2 trillion in sales. By mid-2025, the dealer count had ticked up to 16,972, while first-half vehicle sales had already reached 8.1 million units and $645 billion in dealership sales.
Fixed operations also remained a major contributor to dealership economics. Franchised dealers wrote more than 270 million repair orders and generated more than $156 billion in service and parts sales during 2024. In the first half of 2025 alone, repair orders topped 137 million and service and parts revenue exceeded $81 billion.
U.S. automobile dealer employment trend
Employment across automobile dealers continued to recover and expand through 2024, showing that dealership retailing remains a large employer even as margins normalize and digital retail tools become more common.
| Label | Bar | Value | ||
|---|---|---|---|---|
| 2020 |
| 1,224.3K | ||
| 2021 |
| 1,261.1K | ||
| 2022 |
| 1,297.0K | ||
| 2023 |
| 1,308.9K | ||
| 2024 |
| 1,329.1K |
Max = 1,329.1K jobs. Widths: 2020 92.11%, 2021 94.88%, 2022 97.58%, 2023 98.48%, 2024 100.00%
Average franchised dealership performance in 2024
Presidio-NCM benchmark data suggests the typical franchised store entered a more normalized earnings phase in 2024. The average dealership generated $83.9 million in revenue, retailed 883 new vehicles and 729 used vehicles, and recorded F&I income of $1,581 per retail unit.
Margins were much lower than the extreme highs seen during the inventory shortage period, but profitability still remained elevated compared with pre-pandemic norms. Net pretax profit for the average store fell 24.4% year over year in 2024, yet still stood at 1.7 times 2019 levels.
Average gross profit per vehicle retailed
| Label | Bar | Value | ||
|---|---|---|---|---|
| New vehicle |
| $2,247 | ||
| Used vehicle |
| $1,399 |
Max = $2,247. Widths: New vehicle 100.00%, Used vehicle 62.26%
Independent dealer market statistics
Independent dealers remained a major force in used-vehicle retailing in 2025. NIADA reported that independent used vehicle dealers sold 9.8 million vehicles in 2025, while total used-vehicle sales across all channels were estimated at 38.6 million.
NIADA also notes that the used-vehicle industry includes some 40,000 licensed used auto dealers. On the financing side, buy here, pay here and other in-house lending channels accounted for 32.6% of independent dealer financing, while deep subprime and subprime borrowers made up 34% of independent dealer originations.
Independent dealer share of used-vehicle market in 2025
| Label | Bar | Value | ||
|---|---|---|---|---|
| Independent dealers |
| 9.8M | ||
| Total used sales |
| 38.6M |
Max = 38.6M. Widths: Independent dealers 25.39%, Total used sales 100.00%
Auto financing trends affecting dealerships
Experian’s Q4 2025 finance data shows affordability continued to pressure the market. Average loan amounts rose to $43,582 for new vehicles and $27,528 for used vehicles, while average monthly payments reached $767 for new vehicles and $537 for used vehicles.
New vehicle financing represented 42.2% of auto finance volume in Q4 2025, versus 57.8% for used vehicles. New vehicle leasing remained 24.37% of the market. Longer loan terms also kept growing, with nearly 30% of new loans and 28.68% of used loans falling in the 73- to 84-month range.
For used vehicles specifically, Experian reported that just 36.5% of used buyers financed their purchase in Q4 2024, compared with roughly 80% of new vehicle buyers.
Average vehicle loan amount in Q4 2025
| Label | Bar | Value | ||
|---|---|---|---|---|
| New vehicle |
| $43,582 | ||
| Used vehicle |
| $27,528 |
Max = $43,582. Widths: New vehicle 100.00%, Used vehicle 63.16%
Dealer sentiment in 2026
Cox Automotive’s Q1 2026 Dealer Sentiment Index showed that dealerships entered the spring selling season with better expectations but still weak current conditions. Current market sentiment rose to 41 from 38 in Q4 2025, while the future outlook index climbed to 56 from 42.
At the same time, customer traffic remained weak at 28, the profit index fell to 32, and EV sales sentiment hit a record low of 33. That mix suggests dealers were hopeful about the next few months, but still operating in a challenging affordability and margin environment.
Dealer sentiment index snapshot, Q1 2026
| Label | Bar | Value | ||
|---|---|---|---|---|
| Current market |
| 41 | ||
| Future outlook |
| 56 | ||
| Traffic |
| 28 | ||
| Profit index |
| 32 |
Max = 56. Widths: Current market 73.21%, Future outlook 100.00%, Traffic 50.00%, Profit index 57.14%
Dealership consolidation statistics
The U.S. dealership buy-sell market remained highly active in 2024. Kerrigan Advisors reported a record 438 completed dealership transactions during the year, up 10% from 2023. Those deals involved 697 franchises sold, also one of the strongest results on record.
That activity suggests dealership ownership remains attractive to acquirers even after the post-pandemic profit normalization phase. It also points to continued consolidation among larger dealer groups and sustained interest in well-positioned franchise rooftops.
What these car dealership statistics show
The data points to a dealership industry that remains enormous in scale but is clearly operating in a tougher margin environment than it did during the inventory-constrained years. Franchised dealers are still generating more than a trillion dollars in annual sales, while independent dealers continue to control a meaningful slice of the used-vehicle market.
At the store level, profitability has come down, but it has not collapsed back to pre-2020 norms. Service, parts, F&I, and cost discipline are now doing more of the work. Financing costs remain elevated, longer loan terms are more common, and dealer sentiment shows that operators are still cautious even when forward expectations improve.
Looking into 2026, the biggest dealership themes are likely to be affordability, used-vehicle demand, financing flexibility, fixed-ops performance, and ongoing consolidation.
Sources
- National Automobile Dealers Association, NADA Data 2024 Full-Year Report
- National Automobile Dealers Association, NADA Data 2025 Mid-Year Report
- National Automobile Dealers Association, December 2025 Market Beat
- Federal Reserve Bank of St. Louis and U.S. Bureau of Labor Statistics, Employment for Retail Trade: Automobile Dealers
- The Presidio Group and NCM Associates, Full-Year 2024 Presidio-NCM Average Dealership Performance Benchmark
- Cox Automotive, Q1 2026 Dealer Sentiment Index
- Experian Automotive, State of the Automotive Finance Market Report for Q4 2025
- Experian, Used Car Loans and Financing for 2025
- National Independent Automobile Dealers Association, 2025 Used Car Industry Report updates published in March 2026
- Kerrigan Advisors, 2024 Annual Blue Sky Report